Off the keyboard of RE
Follow us on Twitter @doomstead666
Friend us on Facebook
Published on the Doomstead Diner on July 12, 2015
Visit the New Diner News Page for Daily Updates from around the Collapse Blogosphere

Discuss this article at the Geological & Cosmological Events Table inside the Diner
Going back a few years to my early days exploring collapse phenomena on the PeakOil.com website, "coincidentally" with the massive economic perturbations of 2008-2009, there was a huge Earthquake Swarm at Yellowstone National Park, which sits right over a "hotspot" on the surface of the earth and has been the site where 3 known Supervolcanic Events took place in the geological history of the earth.
The Yellowstone Caldera is the volcanic caldera and supervolcano located in Yellowstone National Park in the United States, sometimes referred to as the Yellowstone Supervolcano. The caldera and most of the park are located in the northwest corner of Wyoming. The major features of the caldera measure about 34 by 45 miles (55 by 72 km).[5]
The caldera formed during the last of three supereruptions over the past 2.1 million years: the Huckleberry Ridge eruption 2.1 million years ago (which created the Island Park Caldera and the Huckleberry Ridge Tuff), the Mesa Falls eruption 1.3 million years ago (which created the Henry's Fork Caldera and the Mesa Falls Tuff) and the Lava Creek eruption 640,000 years ago (which created the Yellowstone Caldera and the Lava Creek Tuff).
For folks interested in Collapse, nothing gets the juices flowing more than contemplating ULTIMATE Fast Collapse scenarios, of which the Supervolcano is among the most interesting, and also the most probable on the Geological level as well, since these things blow off with fair regularity, and it's a certainty one of them will blow again at some point in the future, although you can't pinpoint exactly when that will be. Another difficult timeline question for the kollapsnik here.
The other big one often brought up on the Cosmological level is the posibility of an Earth Collision with a Planet killer Size Asteroid.
These also happen with some regularity, but not as often as supervolcanos blow off. As far as Yellowstone is concerned, based on its cycles so far, it is due or overdue right now for a blowoff, and then there are a few others sprinkled around the planet that could blow at any time.
However, do we really need a Supervolcano to go ballistic for geological disturbances to change the earth climate and ocean chemistry? I don't think so, and evidence seems to bear this out. When the Earthquake Swarm hit Yellowstone in 2009, I became very interested in this phenomenon, and with my friend Stormbringer on PeakOil.com we ran one of the longest running and most popular threads there ever, it went over 100 pages deep in posts (20 to a page) and went on for months. This got me curious about whether there actually was an increasing level of geotectonic activity, aka Earthquakes & Volcanic Eruptions.
At least in the case of Earthquakes when beginning the research, it did appear true that Earthquakes were increasing in both Frequency & Magnitude over the last 20-30 years. This was evident from the graphs supplied by DLindquist of the USGS.
Total Strength 8+ Quakes 1975-2013
Total Strength All Quakes 1975-2013
Now, one of the "debunking" theories here is that there are not more quakes or stronger quakes, just they are being better reported. However, seismographs in 1975 were plenty sensitive enough to measure any quake above say 4 on the Richter Scale anywhere on the Globe, and Geologists all over the world have been recording this stuff going well back to the early 20th Century. So the records are pretty good, especially since 1975 when DLinquist's graphs start off.
Now, earthquakes when they go off release a LOT of energy, the biggest ones past around 9 on the Richter Scale dwarf even the Tsar Bomba, the largest thermonuclear device ever detonated. That would include the Sendai Quake that wrecked Fukushima and the Anchorage Quake of 1964. Here's a list of significant Quakes from Wiki;


Now, this is mostly just the biggies. However, in aggregate you probably get more energy released by the total number of 4-6 Intensity Quakes you get each year than the big ones. Here is the chart for the 4+ Quakes:
The 5+ and 6+ charts are similar, all showing a peak of activity around 2011-2012. All this energy had to go somewhere, where did it go?
Now look at the chart for Ocean Heat Content:

When does ocean Heat Content start rising? 1992, EXACTLY the year you start to see increasing total energy released by Earthquakes! THAT friends is a SMOKING GUN.
What else occurred at the SAME Time? Ocean Acidity levels started rising and the pH dropping (lower pH is Higher Acidity, it's an inverse scale)

As you can see, it was in the late 1980s to early 1990s that Ocean pH began its real roller coaster ride downward below all previous measured minimums going back to 1700. Getting an up to date number for 2015 has so far proved difficult, but I suspect it is well below 7.9 now.
Now, where does Ocean Acidity come from? Well, definitely CO2 contributes here, dissolving in water to form the Bicarbonate Ion, HCO3-. however, Sulfur also adds to ocean acidity, forming the Sulfate Ions.
Sulfur is found in oxidation states ranging from +6 in SO42− to -2 in sulfides. Thus elemental sulfur can either give or receive electrons depending on its environment. Minerals such as pyrite (FeS2) comprise the original pool of sulfur on earth. Owing to the sulfur cycle, the amount of mobile sulfur has been continuously increasing through volcanic activity as well as weathering of the crust in an oxygenated atmosphere.[1] Earth's main sulfur sink is the oceans as SO2, where it is the major oxidizing agent.[2]
How much sulfur does a typical Volcano Eject and what are its effects on the environment?
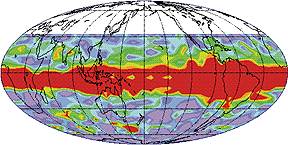
Volcanoes that release large amounts of sulfur compounds like sulfur oxide or sulfur dioxide affect the climate more strongly than those that eject just dust. The sulfur compounds are gases that rise easily into the stratosphere. Once there, they combine with the (limited) water available to form a haze of tiny droplets of sulfuric acid. These tiny droplets are very light in color and reflect a great deal of sunlight for their size. Although the droplets eventually grow large enough to fall to the earth, the stratosphere is so dry that it takes time, months or even years to happen. Consequently, reflective hazes of sulfur droplets can cause significant cooling of the earth for as long as two years after a major sulfur-bearing eruption. Sulfur hazes are believed to have been the primary cause of the global cooling that occurred after the Pinatubo and Tambora eruptions. For many months a satellite tracked the sulfur cloud produced by Pinatubo. The image shows the cloud about three months after the eruption. It is already a continuous band of haze encircling the entire globe. You can learn more about the cooling effects of sulfur hazes by through the sulfur dioxide plume from the Llaima Volcano, which erupted on New Year's Day in 2008.
 Volcanoes that release large amounts of sulfur compounds like sulfur oxide or sulfur dioxide affect the climate more strongly than those that eject just dust. The sulfur compounds are gases that rise easily into the stratosphere. Once there, they combine with the (limited) water available to form a haze of tiny droplets of sulfuric acid. These tiny droplets are very light in color and reflect a great deal of sunlight for their size. Although the droplets eventually grow large enough to fall to the earth, the stratosphere is so dry that it takes time, months or even years to happen. Consequently, reflective hazes of sulfur droplets can cause significant cooling of the earth for as long as two years after a major sulfur-bearing eruption. Sulfur hazes are believed to have been the primary cause of the global cooling that occurred after the Pinatubo and Tambora eruptions. For many months a satellite tracked the sulfur cloud produced by Pinatubo. The image shows the cloud about three months after the eruption. It is already a continuous band of haze encircling the entire globe. You can learn more about the cooling effects of sulfur hazes by through the sulfur dioxide plume from the
 What occurs if the eruption is not into the atmosphere, but directly into the ocean from subsea geotectonic activity?
Submarine volcanoes are underwater vents or fissures in the Earth's surface from which magma can erupt. They are estimated to account for 75% of annual magma output. The vast majority are located near areas of tectonic plate movement, known as ocean ridges. Although most are located in the depths of seas and oceans, some also exist in shallow water, which can spew material into the air during an eruption. Hydrothermal vents, sites of abundant biological activity, are commonly found near submarine volcanoes.
With 75% of the activity coming beneath the ocean (which only makes sense since 75% of the surface of the earth is under water), even a slight increase in the amount of sulfur being released can significantly alter the Sulfur Cycle.

Notice that nowhere in this Sulfur Cycle is the quantity of Sulfur released through volcanic activity each year accounted for. I doubt anyone knows how large this quantity is, or how it changes from year to year or over geologic time either. So it is very difficult to quantify in order to measure its total effect on the ocean chemistry. Regardless of that, if you accept the hypothesis made by the study authors that geological activity was the cause of Dinosaur Extinction, it is reasonable to suppose this quantity can at times be very significant. Is this one of those times?
What about the Volcanoes? Are they really more frequent or just reported better? Here's a chart going back to 1875 from the Smithsonian Institute:

Now, maybe you can argue Volcanic Eruptions are better reported now than in 1875, but that doesn't explain why you see the dropoff in eruptions from 1980-85 and the subsequent higher peak after that.
Besides that, you have this chart with recent numbers in the years 2000-2014

What explains the vast increase between 2007 & 2009? I don't think reporting or instrumentation changed that much over those 2 years.
All of this evidence points to some level of Geotectonic contribution to the changing climate, however nobody in the mainstream of Climate Science will even consider this as it applies to the present day situation, they are too invested in the theory that Climate Change is entirely Anthropogenic and the result of Carbon Emissions from Fossil Fuels since the beginning of the Industrial Revolution. While it seems likely this is a contributing factor, I don't see how you can dismiss the rest of the evidence that there is a Geotectonic component to this as well.
The whole bizness led up to the Geotectonic Ocean Heat Transfer Theory, which you can read up on here on the Diner Blog if you are so inclined.
Despite the fact nobody will apply this reasoning to the current situation, in recent months a new theory about the Extinction of the Dinosaurs at the end of the PETM came not from the preciously accepted Asteroid Impact Theory, but in fact from increasing Vulcanism. Here are Parts 1 & 2 from John Mason on Skeptical Science:
![]()
The cause of the greatest mass-extinctions of all? Pollution (Part 1)
Posted on 19 March 2015 by John Mason
Part One: Large Igneous Provinces and their global effects
Introduction
A mass extinction is an event in the fossil record, a fossilised disaster if you like, in which a massive, globally widespread and geologically rapid loss of species occurred from numerous environments. The “Big five” extinctions of the Phanerozoic (that time since the beginning of the Cambrian period, 541 million years ago) are those in which, in each instance, over half of known species disappeared from the fossil record.
How did they happen? The causes of such events, with a truly global reach, have been a well-known bone of contention within the Earth Sciences community over many decades. The popular media likes to portray such things as Hollywood-style disasters, in which everything gets wiped out in an instant. But in the realms of science, things have changed. The critically important development has been the refinement of radiometric dating, allowing us to age-constrain events down to much narrower windows of time. We can now, in some cases, talk about the start and end of an event in terms of tens of thousands (rather than millions) of years.
Such dating, coupled with the other time-tools of palaeomagnetism and the fossil record, have made it possible to develop a much clearer picture of how mass-extinctions occur. That picture is one of periods of global-scale pollution and environmental stress associated with large perturbations to the carbon cycle, lasting for thousands of years. Such upheavals are related to unusual episodes of volcanic activity with an intensity that is almost impossible to imagine. The geological calling-cards of such events are known as Large Igneous Provinces (LIPs). Bringing environmental and climatic changes at rates similar to the ones we have been creating, they have been repeat-offenders down the geological timeline. This introductory piece examines LIPs in the framework of more familiar volcanic activity: it is the only way to get a handle on their vastness.
For those readers already familiar with LIPs, you may want to skip this and go straight to Part Two, which covers the biggest extinction of them all, at the end of the Permian period, 252 million years ago (Ma). With more than 90% of all species wiped out, it was the most severe biotic crisis in Phanerozoic history. The extinction was global: almost all animals and plants in almost all environmental settings were affected. An idea of the severity can be visualised by considering that the time afterwards was marked by the beginning of a coal gap lasting for ten million years: coal-forming ecosystems simply did not exist for that time. Likewise, Howard Lee has recently considered the relationship between the end-Cretaceous extinction – the one that got the dinosaurs – and LIP volcanism here. But for those who are new to LIPs, it is recommended that you read this post first.
A sense of scale
Let's start by contextualising that volcanicity, starting with an especially well-known example. Mount St. Helens is one of a number of volcanoes in the Cascade Range of the north-western United States. In early 1980, it began a period of activity with earthquakes and clouds of steam billowing forth: by the middle of spring its northern side was starting to bulge ominously, a sure sign of magma and pressure build-up. On May 18th, following another earthquake, its entire northern side collapsed, depressuring the magma and volatiles beneath in an instant. The resulting blast destroyed everything in a 600 square kilometres zone around the northern flank of the volcano. A huge cloud of hot ash shot skywards, reaching over twenty kilometres in height. Ash and debris, mixed with great volumes of meltwater, brought major flash-flooding and mudflows into local rivers. The energy released has been estimated to be equivalent to a 24-megaton nuke and in total this nine-hour eruption spewed out some 2.79 cubic kilometres of felsic lava, ash, gases and debris. Remember that last figure.
The famous eruption of Krakatoa on August 26th-27th 1883 reached its climax on the 27th: the largest explosion, at 10:02 A.M, was heard 3,110 km (1,930 mi) away in Perth, Western Australia. The eruption and the tsunamis associated with it killed over 36,000 people according to official figures. This incredibly violent and destructive eruption, with an energy-release likened to a 200-megaton nuke, produced an estimated 21 cubic kilometres of eruptive products. Again, remember that figure.
Now, contrast those deadly eruptions with the mostly late Permian Siberian Traps LIP. The province contains what may be the largest known volume of terrestrial flood basalt (dark-coloured, iron and magnesium-rich lava) in the world. How much? At least three million cubic kilometres. That's enough to bury an area the size of the United Kingdom beneath a layer of basalt some 12 kilometres thick.
![Scale of volcanicity]()
Fig. 1: We're gonna need a bigger graph! Volumes of well-known volcanic eruptions compared to LIPs. Geologists may argue that comparing single eruptions of various standard volcanoes and LIPs is like comparing apples to oranges. Actually, that's the point!
Definitions
A large igneous province is defined as a vast accumulation, covering an area of at least a hundred thousand square kilometres, of igneous rocks episodically erupted or intruded within a few million years. The majority of erupted products may in some cases accumulate within much shorter time-spans of tens of thousands of years or less. Total eruption volumes are at least a hundred thousand cubic kilometres. Erupted products are dominated by repeated flows of basaltic lava ("flood-basalts"): weathering and erosion of these stacked basalt sheets often gives the countryside where they occur a hilly, stepped topography. Such areas are often referred to today as "Traps" because of this distinctive landscape: the term, as used in "Siberian Traps" or "Deccan Traps" is based on a Swedish word for stairs. Rocks intruded beneath the surface in LIPs include ultramafic (dense, iron and magnesium rich) and alkaline (sodium and potassium-rich) bodies, plus uncommon types such as the carbonate-rich carbonatites. LIP events are infrequent along the geological timeline, with an average of one such event every twenty million years.
![Plate tectonics and the long term carbon cycle]()
Fig. 2: Plate tectonics 101: oceanic crust is erupted at mid-ocean ridges and tens of millions of years later it is consumed at subduction zones. Graphic: jg.
Plate tectonics has over the years been particularly involved with what goes on at existing plate boundaries such as subduction zones and mid-ocean ridges (fig. 2), where magmatism is highly focussed. However, LIPs reflect another set of processes altogether, where vast amounts of mantle-derived magma make it to the surface within plates. They have played a significant role in the development of the hypothesis of great plumes of hot rock and magma occurring deep in Earth's mantle, which create localised "hotspots" that occur irrespective of tectonic plate boundaries and are the sites of major, within-plate eruptions over millions of years. That there is still much lively (and at times acrimonious) debate concerning the Plumes Hypothesis, including postulated alternative formation-mechanisms for LIPs, need not concern us here. That LIP events occurred and how they affected the biosphere is our focus.
Pollution from volcanoes
The Oxford English Dictionary definition of pollution is as follows: the presence in or introduction into the environment of a substance which has harmful or poisonous effects.
Harmful or poisonous effects depend on the physical and chemical properties of any one substance. Substances are widely variable in their toxicity in terms of concentration. Carbon dioxide, essential to photosynthetic plantlife, has other properties which, at higher concentrations, make it dangerous. As a strong greenhouse gas, any substantial increase in its atmospheric levels over a matter of a few centuries make it a pollutant because of the impacts of rapid climate change. At much higher levels it becomes an asphyxiant – a gas that kills by displacing air, thereby causing suffocation, as tragically evidenced in 1986 at Lake Nyos, in Cameroon. Here, the magma underlying the floor of an old volcanic crater-lake gives off carbon dioxide, with which the lake water becomes super-charged. At depth, the pressure of the water-column above keeps the gas stably dissolved in the water. However, any triggering mechanism that suddenly forces a lot of that deep water upwards to shallow levels where that confining pressure is absent can cause it to explosively degas. In the 1986 event, a large cloud of carbon dioxide burst forth from the lake. Due to its relative density, it rolled along the ground, displacing the air as it did so. Over 1,700 people and 3,500 livestock died from asphyxiation in nearby communities. Like many substances, carbon dioxide is best taken in moderation.
All subaerial volcanic eruptions blast out gases and ash into the troposphere and in some cases the stratosphere. The most important volcanogenic gases are water vapour, carbon dioxide, sulphur dioxide and halogen compounds such as hydrogen chloride and hydrogen fluoride.
Of these, only carbon dioxide can contribute to global warming over a geological timescale because of its centuries-long atmospheric residence time (the time it takes natural processes to remove most of it again). At present, global volcanogenic carbon dioxide emissions are calculated to be up to 440 million tonnes a year. This can usefully be compared to human carbon dioxide emissions of (in 2014) 32.3 billion tonnes a year – ours are presently two orders of magnitude greater than those from volcanoes. LIP eruptions are another matter: the entire Siberian Traps LIP eruptive cycle is estimated to have produced thirty thousand billion tonnes of carbon dioxide. Bearing in mind the residence time of carbon dioxide, if eruptive events are continuous or closely-spaced enough to keep recharging the atmosphere with it, a long-lived warming effect would occur.
Sulphur dioxide's greenhouse gas abilities are somewhat stunted as it tends to form sun-blocking sulphate aerosols (suspensions of fine solid particles or liquid droplets in a gas) that have a net cooling effect. Unless an eruption is powerful enough to inject a lot of the gas up into the stratosphere (where sulphur compounds may also cause damage to the ozone layer), the cooling effect is short-term – just a year or two, by which time the sulphate has mostly returned to the surface, dissolved in rainwater and thereby giving a short-term acid rain effect where that rain falls. Stratospheric sulphate aerosols have effects lasting for a few more years, but unless they are continuously supplied then the system recovers to its pre-eruption state. Additionally, because of the way that Earth's airmasses interact with one another as a result of the planet's rotation, gases have to be injected into the stratosphere from a relatively low latitude if they are to be spread on a truly global basis. So a pattern emerges of a steady global warming due to increasing carbon dioxide with shorter, often more regional punctuations along the way in the form of sulphate-induced cooling.
Water vapour quickly cycles back to the surface as rain, bringing with it (in addition to the sulphate) the volcanic ash out of the troposphere. The halogen compounds likewise acidify that rainfall and at higher local concentrations make it directly toxic. Halogen compounds injected into the stratosphere also cause ozone layer damage.
Historically, there are several good examples of problems caused by major eruptions causing short-term atmospheric pollution. A good example is the eight-month long fissure-eruption of Laki, which began in June 1783 in Iceland (a mere 15 cubic kilometres event). Apart from vast amounts of lava, Laki released an estimated 122 million tonnes of sulphur dioxide, fifteen million tonnes of hydrogen fluoride and seven million tonnes of hydrogen chloride. The effect was to leave parts of the Northern Hemisphere shrouded in an unpleasant fog for several months. The acidic, halogen-rich haze and resulting toxic rains were highly damaging to terrestrial life in Iceland, Europe and North America. Livestock mortality in Iceland was over 50% and a quarter of the island's population perished in the resultant famine.
![large igneous provinces and the extinction rate]()
Fig. 3: Extinction magnitude through the past 400 million years plotted against the age and estimated original volume of large igneous provinces. Continental flood basalt LIPs are shown as black bars, while oceanic plateau basalt provinces are shown as gray bars. Abbreviations: D = Devonian; C = Carboniferous; P = Permian; Tr = Triassic; J = Jurassic; K = Cretaceous; T = Tertiary; CAMP = Central Atlantic magmatic province. Figure is adapted from Bond & Wignall, 2014.
Killers and non-killers
The geological timeline of the Phanerozoic (part of which is shown in fig. 3) is marked by a number of LIP events. A few seem to have had little impact on planetary life, especially the oceanic plateau basalt provinces (perhaps underwater eruptions have different outcomes?); some are linked to moderate extinctions and some are linked to major mass-extinctions. Why this variability and what makes a LIP event a killer?
![large igneous provinces: kill-mechanisms]()
Fig. 4: potential kill-mechanisms associated with Large Igneous Provinces. Graphic: jg.
Several factors are clearly critical in determining the outcome of a LIP event. The state of the biosphere and climate prior to an eruption – how stressed the systems are – must be important. Any occurrence of other global-scale events coincident with a LIP eruption – such as a large asteroid impact – would only make things worse. But the most important factor must surely relate to the "three D's" – the distribution, duration and degree of pollution.
Distribution, duration and degree of a pollution event depends on frequency and intensity of eruptive events (the pollutant supply) and the residence times of the pollutants involved. Continuous or very frequent intense events over tens of thousands of years would not only provide sufficient pollutants but give them adequate time to be spread globally at dangerous levels. On the other hand, continuous low-intensity eruption over a similar time may not raise levels of pollutants to harmful values, or perhaps only do so on a regional basis. Low frequency LIP eruptions occurring over longer timespans may still yield vast volumes of lava, but the low frequency allows ecosystem recovery in between eruptions. Therefore, it is possible for some LIPs to have had little more than local effects whereas in others the global ecosystem has been almost completely overwhelmed.
Now we have had an overview of LIPs and their effects, we can look at a specific example in Part Two with the end-Permian mass-extinction, how it occurred and its links to the Siberian Traps LIP – and its significance compared to the pollution caused by modern-day human activities.
Reference
The following paper, available online, is an excellent overview of LIPs and their role in specific extinction events – it also has an exhaustive list of references for further reading.
Bond, D.P.G. and Wignall, P.B. (2014): Large igneous provinces and mass extinctions: An update. In: Keller, G., and Kerr, A.C., eds., Volcanism, Impacts, and Mass Extinctions: Causes and Effects: Geological Society of America Special Paper 505.


![]()
The cause of the greatest mass-extinctions of all? Pollution (Part 2)
Posted on 19 March 2015 by John Mason
Part Two: the Siberian Traps and the end Permian mass extinction
Introduction
With more than 90% of all marine species and 75% of land species wiped out, the end Permian mass extinction was the worst biosphere crisis in the last 600 million years. The extinction was global in reach: almost all animals and plants in almost all environmental settings were affected. An idea of the severity can be visualised by considering that the time afterwards was marked by the beginning of a coal gap lasting for ten million years: coal-forming ecosystems – i.e. forests – simply did not exist for that time.
The onset of the mass extinction coincided with the main part of the eruption of the late Permian Siberian Traps Large Igneous Province (LIP), 251.9 million years ago (Ma). It contains what may be the largest known volume of terrestrial flood basalt in the world. Estimates vary but they start at volumes of at least 3 million cubic kilometres of igneous rocks that were erupted onto and intruded beneath the surface during the event. There are some much larger volume estimates that take into account "missing" erupted rocks since eroded away and the likely ratio of intruded to erupted rocks. Either way, as eruptive cycles go this was one of the biggest ever.
At the same time, there was a dramatic perturbation to the global carbon cycle, involving the injection of enough carbon dioxide to the atmosphere to triple the pre-existing levels and raise temperatures substantially. There were severe problems with other pollutants: acid rain, soil erosion, algal blooms and ocean acidification and anoxia all took a dramatic toll on life on land and in the seas.
That the Siberian Traps eruptions, the greatest of the Big Five mass-extinctions and carbon cycle havoc all happened in broadly the same geological timezone suggests they may not be unrelated. However, coincidence is not necessarily cause. For example, what if the extinction occurred a million years before the Traps were erupted?
To resolve such key questions we make use of high-resolution radiometric dating and biostratigraphy – the precise study of changes in the fossil record over a geologically short and age-constrained time-frame. This post takes a look at the latest advances in research concerning the extinction event and how it unfolded, and then goes on to see how it compares to what we are doing to the planet. It's not exactly good news.
![Earth at the time of the end-Permian mass extinction, 252 million years ago.]()
Fig. 1 (above): Earth at the time of the end-Permian mass extinction, 252 million years ago. Re-annotated from Christopher Scotese' Palaeomap Project.
Fig. 2 (below): Modern-day Asia with the vicinity of the Siberian Traps (see fig. 3 for details) outlined in red.
![location of Traps]()
Constraining time: the Siberian Traps, the mass-extinction and zircons
Getting the exact timing of the Siberian Traps and the mass extinction nailed has long been a major goal of the Earth Science community. In recent years, such age-constraint has materialised, since precise radiometric dating of rocks has come along in leaps and bounds. The sedimentary rocks in the type sections for the Permian-Triassic boundary, in China, have long been scrutinised in depth, their individual beds numbered, their sedimentary characteristics described and their micro and macrofossils catalogued layer upon layer, so that the precise point in the sequence where the extinction occurred has been well-defined.
Fortuitously, there are also beds containing volcanic ash within the critical Chinese sequence. These yield tiny crystals of the mineral zircon, which is zirconium silicate. Zircons may be dated using high-precision methods that exploit the radioactive decay of uranium (a trace element in zircons) to lead. The technique of U-Pb dating, as it is known, involves (in a nutshell) separating out the zircons from a sample of rock – a painstaking process – and through analysis, dating them. Then repeat with the ash-bed above, and the one above that, and so on. As a result of the dating, it is now thought that the onset of the main extinction was at 251.941 +/- 0.037 Ma and its duration was less than 61 +/- 48 thousand years.
![Siberian Traps geology]()
Fig. 3: Geology of the Siberian Traps LIP. The main outcrops of lavas, tuffs and intrusive rocks are shaded green. Basalt lavas that are known or suspected to be buried at depth are shown in red. The estimated limit of the Siberian Traps LIP is indicated by the dotted line. After Saunders & Reichow, 2009.
Zircons are rare in basaltic rocks such as those found in the Siberian Traps, but there are some rocks there from which they can be obtained. The overall subaerial sequence in the Traps (fig. 3) is an early pyroclastics formation – smashed rock and ash formed by explosive volcanic activity, overlain by up to four kilometres of basaltic lava flows. Between some of the lava flows there occur thin felsic tuffs, silica-rich rocks whose precursor was volcanic ash, which do contain zircons. Using new data based on those zircons, the eruption of the Siberian Traps LIP commenced with explosive magmatism and pyroclastic deposition between 255.21 +/- 0.37 Ma and 252.24 +/- 0.12 Ma. Eruption of lava-flows was from then on sustained until 251.904 +/- 0.061 Ma, giving a maximum period of 300,000 years or so for a large part of the lava production. A hiatus then followed for some half a million years before activity recommenced in some areas and kept going until 250.2 +/-0.3 Ma, into the earliest Triassic. It is clear that by the point of the onset of the mass-extinction, a huge quantity of products had been erupted.
Carbon cycle disruption
So: we have the large part of a LIP eruption in the 300,000 year long lead-up to the extinction interval and over it, and we have the extinction itself. What other lines of evidence might connect the two things as being more than coincidental? Firstly, something dramatic happened to the global carbon cycle (the complex system by which carbon is exchanged between organisms, soils, rocks, rivers and oceans and the atmosphere) at precisely the same time. It became grossly overloaded.
Variations in the carbon cycle on Earth are recorded by changes in carbon isotope ratios through time. Carbon has two stable isotopes, carbon 12 and carbon 13, occurring in a ratio of about 99:1. They are partitioned in natural systems: plants, be they mighty trees or lowly green algae, preferentially use carbon 12 in photosynthesis. Things eat plants and thus the resulting isotope shift in favour of carbon 12 is spread up though the food chain. Where the plants and the remains of that food chain end up preserved in the geological record – for example as coal, limestone or other fossil material – they will carry that same, "light" carbon isotope ratio. If the coal is then burned, forming carbon dioxide, it will add that light carbon to the atmosphere and, in due course, to the oceans.
Now, the lead-up to the Permian-Triassic boundary (fig. 4) coincides with a major, negative carbon isotope excursion, lasting for over 500,000 years, of 4 parts per thousand (from +3 to a typical earliest Triassic value of −1‰), as measured in both marine carbonates and organic material. Superimposed on this negative trend there was, during the descent from positive to negative values, a much briefer even more negative spike (from +2 down to −4‰). The spike marked the onset of the extinction itself and, including its subsequent rebound, it had a duration of between 2,100 and 18,800 years. It is so distinctive that it serves as a marker-horizon all over the world, pinning down the start of the extinction-interval even in sedimentary rocks that are unfossiliferous.
![dating and carbon cycle disruption in the late Permian and early Triassic rock sequence in China. After Burgess et al, 2014.]()
Fig. 4: the type section of the Permian-Triassic boundary in southern China, showing the dated ash-beds, the extinction interval and the carbon isotope record from the time including the dramatic, negative spike at the onset of the extinction. After Burgess et al, 2014.
To change, in its entirety, the isotopic ratio of the vast quantities of carbon dissolved in the world's oceans by this amount, requires a massive perturbation to an already-perturbed carbon cycle. It would need the injection, to the atmosphere, of a vast amount of isotopically light carbon. The changes in carbon dioxide levels at the time have been estimated using the stomatal leaf index in fossil plants and isotopic studies of fossilised soils. From around 2300ppm in the late Permian the levels jumped to as much as 7832+/-1676 ppm at the time of the extinction – a trebling. Where could that extra carbon dioxide have come from?
To begin with, it has been estimated that the entire Siberian Traps LIP eruptive cycle produced thirty thousand billion tonnes of carbon dioxide directly from magmatic outgassing. However, mantle-derived carbon dioxide is not that light, which makes it difficult to reconcile as the single source responsible for the isotope excursion. One suggested solution to that problem is that the recycling of subducted oceanic crust into the pre-eruption magma added a lot of lighter carbon to the mix. If that was the case then the eruptions could – perhaps – better account for the isotopic excursion.
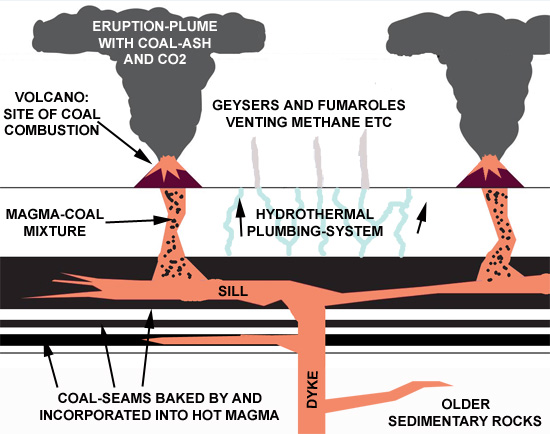
Another quite credible solution involves the liberation of huge quantities of isotopically light carbon dioxide and methane as a consequence of the heating and combustion of coal and petroleum. Such gases are referred to in the literature as "thermogenic", meaning that they were produced by heating stuff. There's an awful lot of coal in the Middle Carboniferous to Lower Permian sedimentary rocks that underlie the Siberian Traps. Beneath that there exists an older Palaeozoic sequence of rocks that includes a great thickness of Cambrian evaporite beds (mostly rock-salt – sodium chloride and anhydrite – calcium sulphate) and associated significant concentrations of oil and gas. Deep pathways for both intruding and erupting magma would have passed up through the evaporites and coal deposits alike, baking them (liberating carbon-based gases) and also bringing coal mixed with magma up to the surface (where it would immediately combust – fig. 5). The explosive nature of such combustion has been calculated to be sufficient to push the eruption-plume up into the stratosphere. Evidence for coal combustion has been discovered in the form of particles closely resembling coal fly-ash in a Permian-Triassic boundary sequence in Arctic Canada. Back then the area was at a similar latitude to and downwind from Siberia, and although other workers have suggested the material could be char from wildfires, which may produce similar particles, comparison of the particles with those making up modern fly-ash shows that they are identical in structure.
Evidence for major gas release associated with the Siberian Traps LIP is present in the form of thousands of hydrothermal vents – deep-seated pipe-like pathways to the surface taken by superheated mineral and gas-rich water – developed in the rocks situated above sills and other intrusions. Some of them are actively mined for the minerals that they contain. Each vent represents a degassing location with surface expressions at the time of the activity in the form of geysers and fumaroles. Hydrocarbon gases such as methane and halogen-bearing compounds like methyl chloride would have been the main products: methane would of course oxidise quickly to carbon dioxide once reaching the atmosphere. It has been estimated that these processes could have added as much as 100,000 billion tonnes of carbon dioxide to the atmosphere.
Fig. 5: Schematic showing the interaction of magma and coal seams in the Siberian Traps. Now multiply this in your minds eye by many times and you have what it was like there in the late Permian. After Ogden & Sleep, 2012.Methane clathrate destabilisation has also been invoked, but with little real evidence in contrast to the volcanogenic and thermogenic sources outlined above: given that both of those scenarios are entirely plausible, it's probable that they both had a role to play. Now, just try to picture the scene at the height of these eruptions. Numerous volcanoes with lava fountains continuously on the go and great lava flows spilling out over the landscape for as far as the eye can see. Towering eruption-plumes of black sulphurous smoke, lightning-riven and merging into a hellish dark canopy stretching over the horizon. In between the volcanoes, bubbling, reeking fields of fumaroles, with clouds of steam and every now and then the whoosh as another explosive geyser shoots skywards, and another and another. Siberia at the height of the Traps eruption would have been like Mordor on steroids.
Kill-mechanisms on a polluted Earth
Unsurprisingly, a variety of kill-mechanisms have been proposed for the end-Permian mass extinction, mostly linked back in one form or another to the Siberian Traps. There is good evidence pointing to a rapid, dramatic increase in marine and terrestrial temperature. Decreases in the oxygen isotope ratios of shallow marine limestones indicate that seawater temperatures across the extinction interval rose by as much as 6–10°C. Studies of ancient soils occurring in terrestrial sedimentary rocks of the same age are consistent with this finding. Problems arising from repeated massive injections of carbon dioxide to the atmosphere would tend to persist over much longer timescales than those caused by other pollutants simply because of the long atmospheric residence time of carbon dioxide. With eruptions taking place even a century or so apart, CO2 levels would be recharged often enough to provide a net atmospheric gain on each occasion.
There is also evidence of severe disruption to ocean chemistry. The calcium isotope records of marine carbonate rocks and of calcium phosphate minerals that preserve conodonts (teeth-like microfossils) have recently been studied at one of the key sections in southern China. Both reveal a negative excursion over the extinction interval. Such parallel negative excursions in both carbonate rocks and conodont calcium phosphate cannot be accounted for by a change in carbonate mineralogy. However, they are consistent with a negative shift in the calcium isotope ratio of seawater, something best accounted for by ocean acidification.
Supporting that assertion is the fact that marine animals suffered significantly different levels of extinction which depended on two key things. These were firstly their requirements for carbonate ions in constructing their skeletons and secondly to what extent they were capable of buffering (controlling) the pH within their cells and maintaining efficient respiration under more acidic conditions. Poorly-buffered forms with the highest need for carbonate ions, such as some corals, were hit hardest; forms whose carbonate ion requirements were minimal fared much better. The generic extinction rates of the two groups at each end of the spectrum of resilience were 86% against 5% respectively. The bottom line is that if you have a skeleton or shell made out of calcium carbonate and the ocean at the depth at which you live turns a bit too acidic (meaning its pH is reduced too much), you are stuffed.
The Traps also gave out huge quantities of sulphur (6300-7800 billion tonnes), chlorine (3400-8700 billion tonnes) and fluorine (7100-13,600 billion tonnes): it has been suggested that these figures may even be an underestimate. Stress inflicted on terrestrial plants by repeated episodes of acidic and toxic rainfall was doubtless a part of the problem. Sulphur dioxide, forming sulphate aerosols in the upper atmosphere, can lead to abrupt albeit short-term cooling and also the impairment of photosynthesis due to partial blocking of sunlight – a so-called “volcanic winter”. However, given the high latitude at which the Siberian Traps eruptive cycle occurred, this would not have been a global effect. For stratospheric pollutants to be spread globally, they need to be introduced closer to the equator, where upper air circulation spreads them towards both poles. More regionally, atmospheric conditions would have ameliorated over a few years as the sulphate returned to Earth in acidic rain, with the climate returning to its hothouse state.
The effects of manmade acidic rain have been studied widely, albeit in modern ecosystems. Prolonged influxes of rain-introduced sulphate and other acidic compounds lead to the leaching of essential bioavailable minerals such as calcium, potassium and magnesium from soils and the spread of the acidity into stream systems: in depleted soils, the trees are affected immediately. Conversely, aluminium gets converted into a bioavailable form, which causes serious disruption to a number of plant metabolic processes. Acidic rainfall of a prolonged nature clearly causes severe ecological damage. Plant community die-off leads inevitably to habitat-destruction and food-chain collapse.
The removal of plant communities over wide areas has other serious effects. Plants bind soils together and act as a physical barrier to their erosion. Take a lot of those plants away and the soil is defenceless. Evidence points to a change in river characteristics at the time, from slowly meandering systems running between vegetated banks to bleak, braided gravelly channels of the type which dominated the land surface for the hundreds of millions of years before plants colonised it. There was an abrupt influx of land-derived sediment into the sea at the time, burying shallow, limestone-forming sea-beds all around the world. The rocks record major soil-erosion to have continued for some time after the extinction itself, a sure sign of the lasting nature of such environmental damage.
Increased soil removal by rainfall and rivers led in turn to increased nutrient flux to the sea, causing marine algal blooms and the consequential development of "dead-zones", extensive areas of ocean anoxia. There exists abundant isotopic, geological and biological evidence for widespread hypoxia or anoxia in marine sediments spanning the Permian-Triassic boundary from all around the world. In anoxic conditions, sulphate-reducing bacteria are able to thrive: liberating hydrogen sulphide as a metabolic product, they can produce a condition termed euxinia, meaning sea water with a high sulphide concentration, and toxic to many other marine creatures. Euxinic conditions do occur in today's oceans, but are localised and mild. It has even been suggested that euxinia became so widespread at all depths in the end-Permian oceans that it reached the surface, outgassing to the atmosphere. Atmospheric hydrogen sulphide at concentrations of more than 500 ppm can make you very unwell very quickly: never take anyone seriously who says that gases occurring in trace amounts are by definition harmless.
![Clobbered from all sides - the end-Permian environmental disaster]()
Fig. 6: Clobbered from all sides – the many kill-mechanisms at work in the end-Permian environmental disaster. Graphic: jg.
We may not be able to travel back in time to see what actually happened at the end of the Permian, but we continue to gather the evidence. As Gimli famously remarks in the second part of Lord of the Rings, "No sign of our quarry, but what bare rock can tell!" Today, the rocks are giving up more and more information about past conditions with each passing decade. In the case of the end-Permian, they point to wild temperature swings, acidic rainfall, dead plant communities, massive soil erosion, toxic, acidified seas (fig.6): in other words, the biosphere was clobbered from all directions, repeatedly.
Are we creating the same issues now?
There seems little doubt about it: a massive volcanic episode like the Siberian Traps, volcanism unlike anything Humanity has witnessed, has the potential to create a massive and multi-faceted pollution event on a global scale, with deadly serious consequences for climate, land and ocean chemistry. Could modern human activities have the same effect?
There are a number of differences between Earth today and in the late Permian: some work in our favour and some not.
Firstly, although the late Permian already had a Hothouse climate with high carbon dioxide levels, it is not the absolute levels of CO2 that matter so much: rather, it is the rate at which they change. The rate of emissions in the end-Permian episode, as witnessed by the carbon isotope-spike at the point of the extinction, exceeded the ability of both oceans and biosphere to absorb them. The result was environmental catastrophe. So even though we're not starting with the same conditions as the late Permian, we can't take too much comfort from that fact.
Secondly, geography: in the late Permian there were no polar ice-caps and continental configuration was quite different with landmasses mostly lumped together in the Pangaea supercontinent. End-Permian sea-level rise would have involved thermal expansion alone: in this case we are at greater risk because there are major ice-caps available to melt.
Thirdly, it is thought that late Permian ocean circulation was sluggish, making it easier for anoxic conditions to develop than is the case now with our generally well-mixed oceans.
Fourthly, the sulphur dioxide released by the Siberian Traps volcanism has no modern anthropogenic equivalent. Our sulphur dioxide emissions peaked at ca. 130 million tonnes a year in the 1980s when treaties were agreed to limit pollution from them and the trend is gradually downwards. Compared to the estimate for the Siberian Traps (6300-7800 billion tonnes), one can see that even a century of human emissions at peak levels would still be orders of magnitude less.
An estimated massive (100,000 billion tonnes) carbon dioxide release is thought to have been responsible for the dramatic carbon isotope-spike accompanying the extinction. Let me make this plain: such a spike cannot be generated without something of a drastic nature happening that involves a lot of carbon. The underground cooking of hydrocarbon-bearing evaporite and coal-bearing rock sequences by hot magma has been convincingly blamed for at least part of the release. So how does it compare to our CO2 emissions of ca. 32.3 billion tonnes a year? The late Permian carbon isotope-spike lasted some 2,100 to 18,800 years. Let's round off the figures to make them easier to see in the mind's eye: 2000 to 20,000 years. On the 2000 year scale, to produce a carbon dioxide burp of this magnitude, 5,000 billion tonnes would need to be emitted per century: on the 20,000 year scale it would take 500 billion tonnes per century. That's the range. Our emissions, if they carry on at the present (2014) rate? 3,230 billion tonnes per century. The conclusion is stark: we are outgassing carbon dioxide at the same (or greater) rate as a Large Igneous Province whose overall effects killed most of life on Earth at the end of the Permian.
Late Permian volcanism and associated mass extinction took place, it is thought, over a maximum of several tens of thousands of years. Our self-inflicted environmental changes, assuming for one dreadful moment that we don't get cracking and do something about them, are occurring over a few centuries. The kill-mechanisms may differ slightly from the end Permian events because of the differences outlined in the paragraphs above, but the most likely cause of any future large-scale extinction is nevertheless clear: prolonged environmental stress caused by widespread pollution. Extinction-level events occur when changes to the environment's physical and chemical properties occur on too widespread and rapid a basis for many species to successfully adapt or migrate. If anyone can think of a better incentive to clean our act up than that, let's hear it.
Part One: Large Igneous Provinces and their global effects
Related: So what did-in the dinosaurs? A murder mystery…
References
This is not an exhaustive list but the findings in these papers (obtained via Google Scholar) are all incorporated in the above account. The new radiometric dates are the work of Burgess and colleagues. For a good general account of LIPs and their effects, the Bond and Wignall paper is a good place to start.
Benton, M.J. and Newell, A.J. (2014): Impacts of global warming on Permo-Triassic terrestrial ecosystems. Gondwana Research 25, 1308–1337.
Bond, D.P.G. and Wignall, P.B. (2014): Large igneous provinces and mass extinctions: An update. In: Keller, G., and Kerr, A.C., eds., Volcanism, Impacts, and Mass Extinctions: Causes and Effects: Geological Society of America Special Paper 505.
Burgess, S.D., Bowringa, S. and Shenb, S. (2014): High-precision timeline for Earth’s most severe extinction. PNAS, vol. 111, no. 9, 3321.
Burgess, S.D. (2014): High-precision U/Pb geochronology of large igneous provinces and mass extinctions : testing coincidence and causation. Ph. D. thesis, Massachusetts Institute of Technology, Department of Earth, Atmospheric, and Planetary Sciences.
Dobretsov, N.L., Kirdyashkin, A.A., Kirdyashkin, A.G., Vernikovsky, V.A. and Gladkov, I.N. (2008): Modelling of thermochemical plumes and implications for the origin of the Siberian traps. Lithos 100: 66-92.
Grasby, S.E., Sanei, H., and Beauchamp, B. (2011): Catastrophic dispersion of coal fly ash into oceans during the latest Permian extinction: Nature Geoscience, v. 4, p. 104–107.
Hinojosa, J.L., Brown, S.T., Chen Jun, DePaolo, D.J., Paytan, A., Shen Shuzhong and Payne, J.L. (2012): Evidence for end-Permian ocean acidification from calcium isotopes in biogenic apatite: Geology, v. 40, p. 743–746.
Kump, L.R., Pavlov, A. and Arthur, M.A. (2005): Massive release of hydrogen sulfide to the surface ocean and atmosphere during intervals of oceanic anoxia. Geology, v. 33, no. 5. p. 397–400.
Ogden, D.E. and Sleep, N.H. (2012): Explosive eruption of coal and basalt and the end-Permian mass extinction. Proceedings of the National Academy of Sciiences USA 109(1): 59-62.
Retallack, G.J. and Jahren, A.H. (2008): Methane Release from Igneous Intrusion of Coal during Late Permian Extinction Events. The Journal of Geology, volume 116, p. 1–20
Saunders, A. and Reichow, M. (2009): The Siberian Traps and the End-Permian mass extinction: a critical review. Chinese Science Bulletin, vol. 54, no. 1, 20-37.
Schobben, M., Joachimski, M.M., Korn, D., Leda, L. and Korte, K. (2014): Palaeotethys seawater temperature rise and an intensified hydrological cycle following the end-
Permian mass extinction. Gondwana Research, Volume 26, Issue 2, 675-683.Self, S., Schmidt, A. and Mather, T.J. (2014): Emplacement characteristics, time scales, and volcanic gas release rates of continental flood basalt eruptions on Earth Geological Society of America Special Papers, 505. 319 – 337.
Sephton, M.A., Looy, C.V., Brinkhuis, H., Wignall, P.B., De Leeuw, J.W. and Visscher, H. (2005): Catastrophic soil erosion during the end-Permian biotic crisis: Geology, v. 33, p. 941–944.
Sephton, M.A., Jiao, D., Engel, M.H., Looy, C.V. and Visscher, H. (2015): Terrestrial acidification during the end-Permian biosphere crisis? Geology, v.43, p 159-162.
Sobolev, A.V., Sobolev, S.V., Kuzmin, D.V., Malitch, K.N. and Petrunin, A.g. (2009): Siberian meimechites: origin and relation to flood basalts and kimberlites. Russian Geology and Geophysics 50, 999–1033.
Svensen, H., Planke, S., Polozov, A.G., Schmidbauer, N., Corfu, F., Podladchikov, Y.Y., and Jamtveit, B., 2009, Siberian gas venting and the end-Permian environmental crisis: Earth and Planetary Science Letters, v. 277, p. 490–500.


This of course is a completely different theory than the previously accepted idea that the Dinosaurs bit the dust resultant from and Asteroid Collision.
Interestingly enough, numerous scientists have taken this as evidence that "Pollution" was the cause of Dinosaur Extinction, just in this case said Pollution came from natural Earth Processes which burned up a lot of stored Carbon and caused the various cascading effects we observe now, this time as these scientists believe because of the Anthropogenic burning of fossil fuels.
Can you really call it pollution though if the Earth itself does this periodically? Apparently, it is part of the Earth's cycles to periodically burn up all the Carbon that the life forms store up over time. Not a whole lot different than forest fires, just on a much longer time scale.

There is little doubt that forest fires like this put Gigatons of CO2 up into the atmosphere when they light up, like they are in Alaska as I write this article.
Large wildfires in the western United States can pump as much carbon dioxide into the atmosphere in just a few weeks as cars do in those areas in an entire year, a new study suggests.
As forest fires devour trees and other plants, they release the carbon stored in the vegetation into the atmosphere.
Scientists at the National Center for Atmospheric Research (NCAR) and the University of California used satellite observations of fires and a computer
model to estimate just how much carbon dioxide is released based on the amount of vegetation that is burned. The results of the study are detailed in the online journal Carbon Balance and Management.

Why is it so hard to believe that Volcanic Activity, which sources energy far greater than that available at the surface of the earth could not be emitting far more Sulfur into the environment and far more heat than that possible either by Homo Sap bunring fossil fuels or Wildfires going off? There are many cycles involved here with both the Earth and the Sun that we do not know how they work or on what time scale either. The sun itself can emit more or less energy on a periodic basis. Ice Ages come and go on a periodic basis. If you accept the theory that geotectonic forces caused the Extinction of the Dinosaurs, what was it that set off those forces? Until you can explain these phenomena, you can't simply ascribe all the effects we see these days to anthropogenic causation and the burning of fossil fuels, although this no doubt is also a contributing factor.
Besides not knowing precisely how much Sulfur gets ejected each year by subsea volcanoes, there is also no means to determine precisely how much heat the Earth radiates through the crust directly beneat the Ocean. Today, you might sink down some sensors which could measure that, but you have no historical reference point for it. You don't have sensor readings from 1975 to compare with, and you certainly do not have readings from the PETM to know how hot the ocean floor was then. The only thing you really can compare are the gross morphological changes which occur with really big earthquakes and/or volcanic eruptions, and the latter mainly limited to eruptions that occur on land based Volcanoes, not subsea ones. So this is a difficult theory to quantify, which is probably one of the reasons your typical scientist won't touch it with a 10 foot pole.
What just about no Climate Scientist will do these days is attribute Climate Change to anything BUT Anthropogenic Causation. Why is that?
Primarily I think it is because there is a huge political component involved here, and because many of these scientists are also folks who are disgusted with the damage that industrialization has brought to the planet, which is extensive regardless of whether it is the principle cause of climate change or not. Even in the absence of climate change, Industrialization has turned most of the planet into a sewer, and it's only getting worse every day. So they blame Homo Sap for everything, and won't even consider the idea that perhaps the Earth is going through another of it's geological cycles where the core heats up, increased earthquakes and vulcanism result from that, and burning of stored Carbon and melting Clathrates results in turn from that.
What this evidence DOES show however is that even if you burn up virtually all the Carbon available to the Ecosphere (a thin layer of the earth that goes from a few miles below sea level to a few miles above), the Earth system never seems to progress to runaway Venusian style Global Cooking, but rather plateaus out at around 12C+ above the current average global temperature, at 22C.

22C is equivalent to ~72F, which is quite a survivable temp for both Homo Sap and the plants and animals he feeds on. Besides that, it is an AVERAGE Global Temp, and the Temps at the higher latitudes are likely to be a good deal lower than that. So just on the basis of Global Warming, it is quite a stretch to say that a 4C rise in Global Average Temp will destroy all habitat and make it impossible for any Homo Sap to survive anywhere.
This of course does not take into account the many other things which threaten the long term survival of Homo Sap, including all the Nuke Puke out there and the distinct possibility of a Disease or many diseases with high infection rates and high mortality rates may develop during the spin down. Both of these are probably likely, but neither is likely to completely wipe Homo Sap off the map on a 20 year timeline as Guy McPherson promotes, or even on a Century long timeline. For an extinction level event to go that fast, you really would need the Planet Killer Asteroid, not even Yellowstone going Ballistic would do it across the whole globe.
Is this Good Newz? Yes and No. No, it's Bad Newz because even without going Extinct in 20 years, the kind of population knockdown we are set up for here and looks close to unavoidable is absolutely HORRIFIC. It's hard to imagine how any survivors will cope with such a vast and rapid change, along with all that death surrounding them, even spread out over a Century.
The Good Newz is that this is HIGHLY unlikely to cause the Extinction of ALL life on Earth in the near or even medium term, although in the long term this is guaranteed when the Sun Goes Red Giant (or actually a bit before that). Beyond that, it's unlikely Homo Saps and Sentience gets wiped out that fast either, and we have some chance to rebuild for a Better Tomorrow, at least those who make it through the Zero Point may have such an opportunity.
In the meantime, you basically have two choices here, which are:
1) Give up Hope, go into "Hospice", Roll Over and DIE (the NBL Philosophy)
or
2) Maintain Hope, Never Give Up, Never Say Die, Keep on Going through Hell until you get to the Other Side, Never QUIT until the Fat Lady sings for you. (the Diner Philosophy)

If anybody has reason to opt for Door #1, I do. I'm a mess, and have lived longer than I should have already. But I am NOT GOING TO QUIT! I will FIGHT TO SURVIVE for as long as I can, because the purpose of living is just to live for most creatures. For Sentient Creatures, there is one more Imperative, which is to learn as much as you can before you Cross the Great Divide. Every additional minute you stay alive is one more minute you can learn something, and come that much closer to Eternal Truth before you pass into the Great Beyond.. What happens after that remains an Impenetrable Mystery, but it seems highly unlikely to me that it is all meaningless and without any purpose, and while alive you try to figure that meaning & purpose out to the best of your ability.
Then you die, and something else happens.
SEE YOU ON THE OTHER SIDE